Using the Run page
The Run page is used
to run the analysis, save syntax for later use, and to access output files.
Running a model
Standard output file (HTML format)
Standard output file (TXT format)
Displaying graphs
Running a model
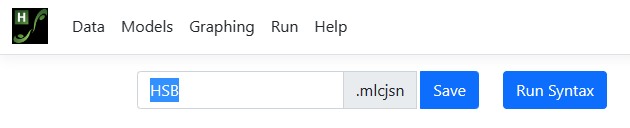
The Run page is used
to initiate analysis and access output files. When first opened after setting
up a model, only two fields are active: Save and Run Syntax. Save
is used to save all the specifications for the model and graphing to a file
with MLCJSN extension. By default, the file name of the MLCJSN file will
correspond to the file name of the data file. To provide a new name, simply
amend the default name and save the file for potential later use.
 The Run Syntax button
is used to start the analysis. Using it is not dependent on first saving the
syntax: model specifications will automatically be saved to the name shown in
the Save field, though with the default name as discussed above.
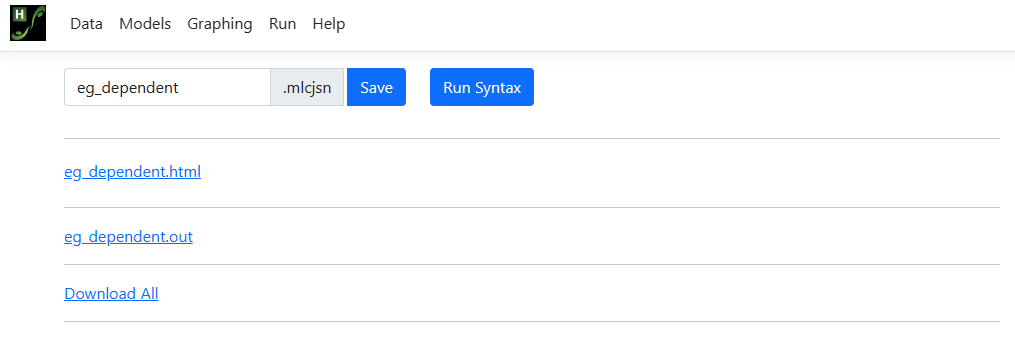
Once analysis is complete, close the Progress window using the Close button. The Run page
will display links to all output files for viewing or downloading.
The Run Syntax button
is used to start the analysis. Using it is not dependent on first saving the
syntax: model specifications will automatically be saved to the name shown in
the Save field, though with the default name as discussed above.
Once analysis is complete, close the Progress window using the Close button. The Run page
will display links to all output files for viewing or downloading.
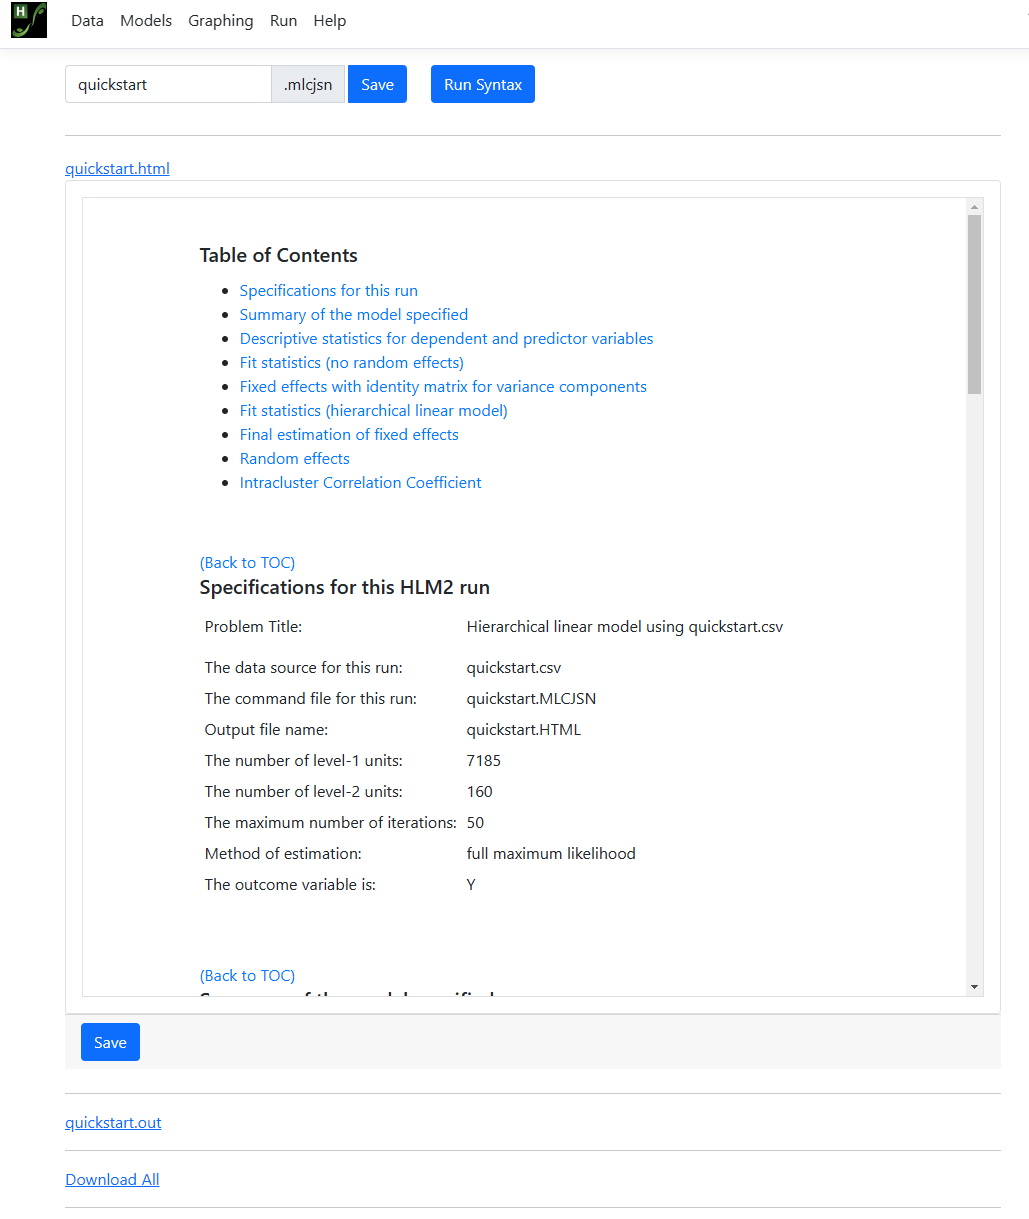
Standard output file (HTML)
Once the run has been completed successfully, the HTML output can be viewed from the Run page
by clicking the link for this file:
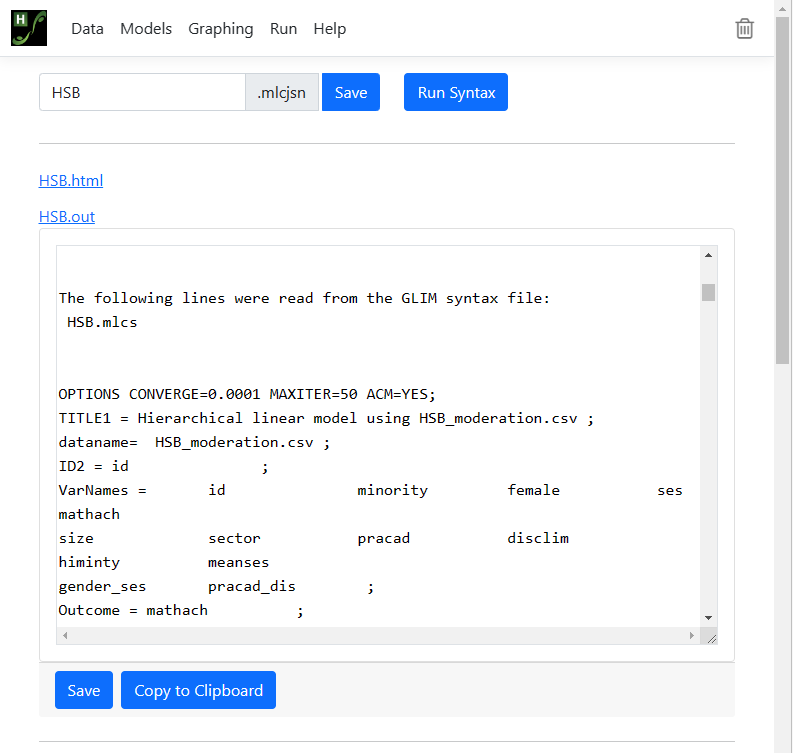
Standard output file (TXT format)
The output file is also provided
as a *.txt file that may be accessed from the Run page. Close the tab
showing the HTML output to return to the Run page. On the Run
page, the Progress window, which shows iterative detail for the
analysis, is still open. Note that information in this window may also to be
copied to the clipboard – a handy feature in case of incomplete runs as
information reported here will be valuable for troubleshooting.
Close this window, and return
to the Run page. Options on this page have been updated, and now have
links to the output in both HTML and TXT format. Below is an example of output
in TXT format obtained by clicking on the link HSB.OUT. Again, users can
copy information from this window to the clipboard for use in another
application.
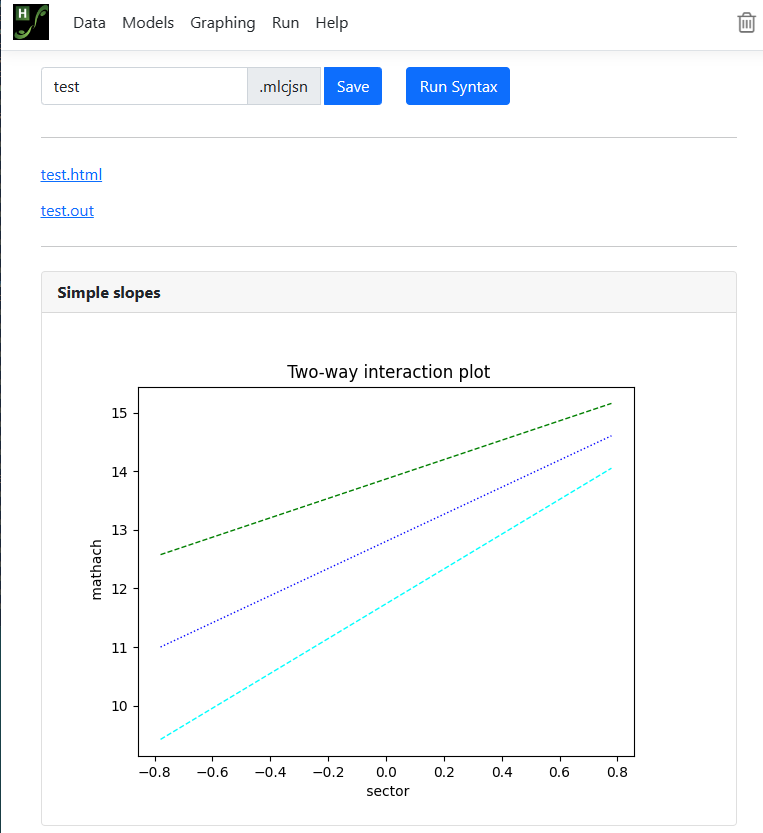
 In the case of moderation
analyses, simple slope and/or confidence interval graphs settings may be
modified on the Graphing page. Information entered on the Graphing
page is also saved to the MLCJSN file, allowing the user to rerun an analysis
and obtain the same graphs at a later date. By default, the program will
produce both simple slopes and a confidence intervals graphs using the default
values shown on the Graphing page. Graphs will be displayed on the Run
page, from where they can be copied and used in, for example, a word processing
program. The image below shows a simple slopes graph for a simple moderation
analysis.
In the case of moderation
analyses, simple slope and/or confidence interval graphs settings may be
modified on the Graphing page. Information entered on the Graphing
page is also saved to the MLCJSN file, allowing the user to rerun an analysis
and obtain the same graphs at a later date. By default, the program will
produce both simple slopes and a confidence intervals graphs using the default
values shown on the Graphing page. Graphs will be displayed on the Run
page, from where they can be copied and used in, for example, a word processing
program. The image below shows a simple slopes graph for a simple moderation
analysis.