Using the Data page
The Data page is used to read in data.
Opening a data file
Selecting variables
Using weights
What to do if variables are assigned incorrectly to levels
Opening a data file
The Data page is used to read in data. Click on Select file to open an Open dialog box
to select a data file. Currently, only Comma Separated Value (*.csv)
files can be used as input.
 Click on Select file to open an Open dialog box to select a data file.
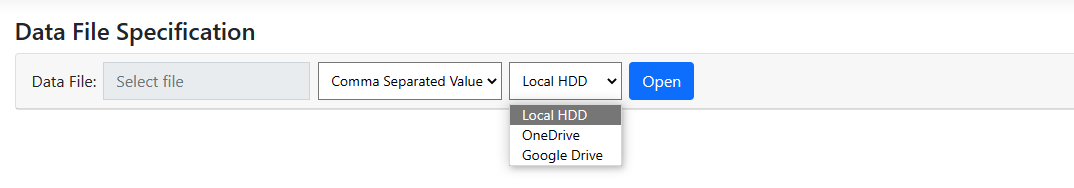 By default, it is assumed
that the data file is on the local hard drive disk (Local HDD). However,
one may also use an URL, OneDrive of Google Drive to
select the file from.
Once the file name, type and location has been specified,
click Open to display the contents of the data file. Note that by using
the scroll bars on the right and at the bottom of the first table all data in
the selected data file can be accessed for inspection.
By default, it is assumed
that the data file is on the local hard drive disk (Local HDD). However,
one may also use an URL, OneDrive of Google Drive to
select the file from.
Once the file name, type and location has been specified,
click Open to display the contents of the data file. Note that by using
the scroll bars on the right and at the bottom of the first table all data in
the selected data file can be accessed for inspection.
 The next step is to select the variables identifying the
hierarchical structure, along with the outcome and potential predictor
variables.
The next step is to select the variables identifying the
hierarchical structure, along with the outcome and potential predictor
variables.
Selecting variables
In this example, we use the data from the High School and
Beyond Study of 1982 and set up a model closely following some of the models in
Chapter 4 of the well-known Raudenbush & Bryk (Sage, 2nd
Edition) text. Here we concentrate on how to set up the analysis, but readers
are strongly urged to also read the relevant chapter to gain more insight into
the model design decisions and interpretation of results obtained.
Data were available for a subsample of students and schools
surveyed in 1982. The sample includes information on 160 schools, with a total
of 7185 students nested within these. At a school level, we have the following
information:
- Type of school, as represented by the variable
sector. This variable assumes values of either 0 or 1, indicating whether the
school is a public or Catholic school.
- A measure of the average socio-economic status
of students within each school, represented by the variable MEANSES.
For each student, we have information on
-
A standardized measure of mathematical achievement (MATHACH)
- The student’s socio-economic status (SES). This measure is a composite of parental education and occupation and the income
of the household.
-
With the students nested within a school, we define the
lowest level of the hierarchy as the student level, and the second level as the
school level. The focus here is to determine to what extent schools differ in
the mean mathematics achievement, taking both socio-economic status and school
sector into account.
The data are stored in the file example.csv. The
first few lines of this comma-separated values file are shown above.
The first line of the file contains the variable names. Each subsequent line contains information for a
student. The file contains additional variables as well, such as female,
representing the gender of a student.
The first column, ID, contains the ID number of
the school a student belongs to. This is followed by all student level
information and all school level information for the school in question. Here
we are looking at data from school with ID = 1224.
School level information for this school, for
example the information on SECTOR and MEANSES, are appended to the record for
each student in the school.
It is easy to see that while
student level variables such as MATHACH changes from student to student, values
for school level variables such as MEANSES stays the same over all students
within the school.
Specifying the data starts with identifying the ID
variable(s). For a two-level model, only a level-2 ID is
required. This variable must be indicated first before any other variable
selection can take place. For a three-level model, an ID for both level-2
and level-3 must be specified. The level-3 ID can be specified once the level-2
ID has been specified.
If a level-1 weight is to be specified, this
should be done next by checking the check box in the Weight1 field under
the weighting variable’s column. Note that for an HLM model, up to three
weights (one at each level) may be used. For GLIM models, weighting is only
available at level-1.
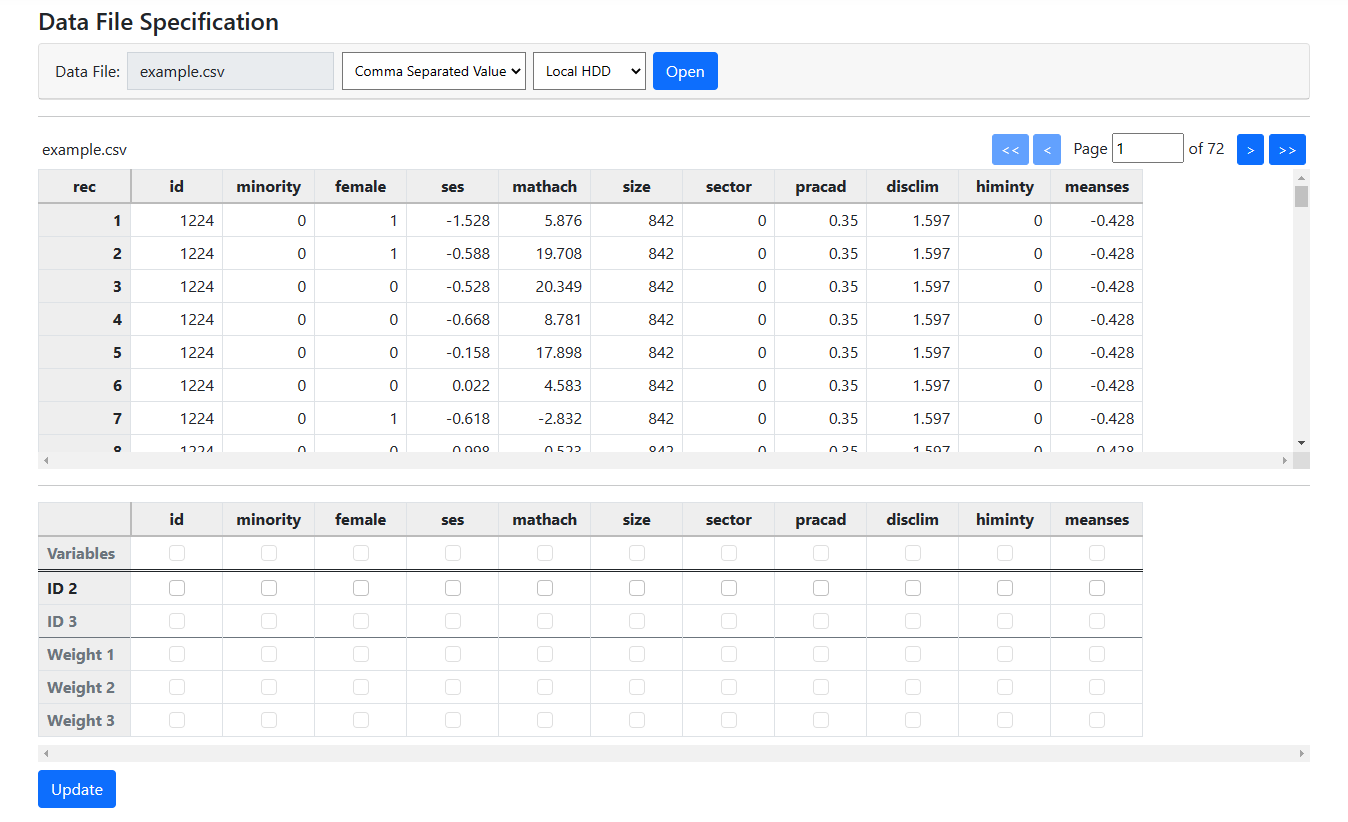
The outcome and predictor variables are specified next. To
select a variable, use the check boxes in the Variable field(s) to
select outcome and potential predictor variables. Here is an example of
variables selected for a two-level model based on the well-known HS&B data:
 We know that MINORITY, FEMALE, SES and MATHACH are student (level-1) variables, and
SIZE, SECTOR, PRACAD and MEANSES are school
(level-2) characteristics. Click the Update button to request the
program to perform allocation of the selected variables to the appropriate
levels. Once Update has been clicked, the second table changes to
We know that MINORITY, FEMALE, SES and MATHACH are student (level-1) variables, and
SIZE, SECTOR, PRACAD and MEANSES are school
(level-2) characteristics. Click the Update button to request the
program to perform allocation of the selected variables to the appropriate
levels. Once Update has been clicked, the second table changes to
 Variables have now been allocated to the levels. Should a
change be required, make the necessary changes, and click the Update
button again. Should you want to request the program to reallocate the level
assignments to the original allocation as made by the program, click the Reallocate
Levels button to return this table to its original state.
Selecting variables for a three-level model is done in the
same way.
Variables have now been allocated to the levels. Should a
change be required, make the necessary changes, and click the Update
button again. Should you want to request the program to reallocate the level
assignments to the original allocation as made by the program, click the Reallocate
Levels button to return this table to its original state.
Selecting variables for a three-level model is done in the
same way.
Using weights
For analyses run with adaptive quadrature estimation, that
is all the models with the exception of Normal (HLM) distribution type,
a single level-1 weight may be used. When running a Normal (HLM) outcome
type, three weights (one at each level) may be specified.
What to do if variables are assigned incorrectly to levels
Once variables are selected on the Data page,
clicking the Update button prompts the program to automatically
determine the appropriate level of the hierarchy each variable is associated
with. Sometimes, however, problems can occur. To illustrate, consider the
following example, based on the well-known HS&B data, in which students are
nested with schools and we have information on the mean socio-economic status
of each school represented by the variable MEANSES.
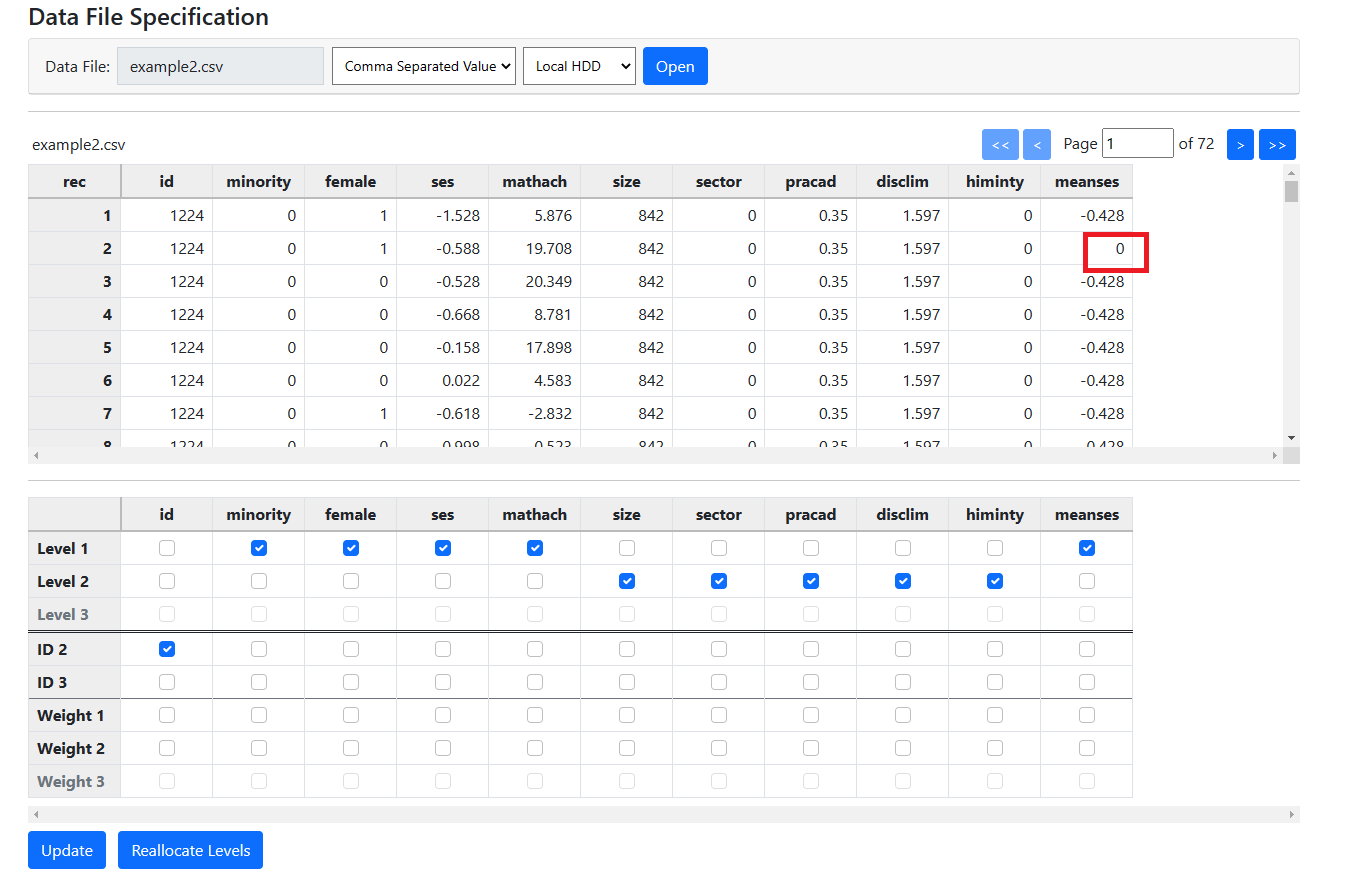 In this case, the program assigned the variable MEANSES to
level-1. This is surely incorrect, as we know it to be a school rather than a
student characteristic, representing the mean SES of a school.
Inspection of the data in the first table for this variable
shows that, instead of having the same value for MEANSES for all students
within school with ID 1224, the data for the second student (second record)
shows a value of 0. This means that the values of this variable change within a
school over students, and do not remain constant for all students within the
school as a true level-2 variable should. This is most likely a data entry
error and the best solution would be to clean the data and inspect it for
similar problems with other variables.
However, the program does allow the user to override program
allocation without editing the data. If a user wishes to proceed regardless,
the level-1 check box for MEANSES
can be unchecked and the level-2 check box can be checked instead. Clicking the
Update button again will retain this modification. In effect, the
program respects the user’s opinion.
Should the user prefer the program’s allocation at a
later stage, clicking Reallocate Levels will reset the level allocation
to the initial automatic allocation performed by the program.
In this case, the program assigned the variable MEANSES to
level-1. This is surely incorrect, as we know it to be a school rather than a
student characteristic, representing the mean SES of a school.
Inspection of the data in the first table for this variable
shows that, instead of having the same value for MEANSES for all students
within school with ID 1224, the data for the second student (second record)
shows a value of 0. This means that the values of this variable change within a
school over students, and do not remain constant for all students within the
school as a true level-2 variable should. This is most likely a data entry
error and the best solution would be to clean the data and inspect it for
similar problems with other variables.
However, the program does allow the user to override program
allocation without editing the data. If a user wishes to proceed regardless,
the level-1 check box for MEANSES
can be unchecked and the level-2 check box can be checked instead. Clicking the
Update button again will retain this modification. In effect, the
program respects the user’s opinion.
Should the user prefer the program’s allocation at a
later stage, clicking Reallocate Levels will reset the level allocation
to the initial automatic allocation performed by the program.